Over the past few years, Smart Money Concepts have taken the crypto trading world by storm. Scroll through any trading forum, YouTube channel, or Discord group and you’ll see charts filled with BOS labels, liquidity pools, and institutional zones. The idea sounds compelling: if traders can identify where large players operate, they can ride the same waves that move the market. Yet many retail traders discover a frustrating truth. Their carefully drawn liquidity levels often fail, their entries get stopped out, and price seems to move toward levels they never anticipated. The problem is rarely the theory itself. The problem is that most traders attempt to apply Smart Money Concepts without access to real institutional order flow crypto data. Without tools that reveal where liquidity actually sits, Smart Money analysis becomes little more than an educated guess. Modern markets move on data, not just patterns. The real edge appears when traders learn to bridge the gap between SMC theory and real-time liquidity information.
Why Smart Money Concepts Alone Often Fail Retail Traders
Many traders approach Smart Money Concepts as if they were a collection of chart patterns rather than a framework based on liquidity behavior. They mark equal highs and lows, label structure shifts, and attempt to predict where institutions might place orders. However, without understanding crypto market microstructure analysis, these markings often become subjective. Two traders can analyze the same chart and produce completely different interpretations of the same liquidity zone. The market itself does not move based on drawings; it moves based on the interaction between buyers, sellers, and liquidity availability. This is why relying on visual structure alone often leads to inconsistent results.
The missing piece is data. Institutional traders do not rely solely on candlestick patterns when making decisions. They monitor liquidity density, order flow changes, and hidden pockets where stop losses accumulate. Without proper SMC trading tools crypto, retail traders cannot see these dynamics. Instead, they attempt to identify institutional reloading zones based purely on price action. Sometimes the guess works. Often it doesn’t. Real validation requires platforms capable of visualizing how liquidity clusters form and where large participants interact with the market.
Another common issue involves misinterpreting liquidity. Traders often assume that every equal high represents a liquidity target, yet real markets contain layers of stop orders scattered across multiple price ranges. Without tools that expose institutional stop loss clusters crypto, traders cannot distinguish between weak liquidity pockets and high-density zones where institutions are more likely to engage. As a result, the market frequently moves through their anticipated levels and continues toward deeper liquidity areas that were invisible on the standard chart.
Understanding Institutional Order Flow in Crypto Markets
To truly understand Smart Money behavior, traders must shift their focus from static chart levels to the dynamic flow of liquidity. Institutional order flow crypto describes how large participants interact with available liquidity when entering or exiting positions. Unlike retail traders, institutions rarely place orders all at once. Doing so would move the market against them immediately. Instead, they accumulate or distribute positions gradually, often targeting areas where liquidity is abundant. These areas typically include stop-loss clusters, breakout entries, and liquidation pockets where other traders’ orders are waiting.
This is where crypto market microstructure analysis becomes essential. Market microstructure examines how orders are matched, how liquidity is distributed, and how price reacts when large volumes interact with the order book. In crypto markets, liquidity is fragmented across exchanges and derivatives platforms. Institutions exploit this structure by triggering liquidity events that allow them to execute large orders with minimal slippage. To the untrained eye, these moves may look like sudden volatility. In reality, they are often carefully engineered liquidity events.
One of the most powerful signals within institutional order flow involves clusters of stop losses. When price approaches areas with dense concentrations of protective stops, a cascade of orders can trigger rapid movement. These institutional stop loss clusters crypto often act as temporary magnets for price. Institutions frequently target them not only to capture liquidity but also to create momentum that allows them to reposition their exposure at better prices.
Where Big Money Is Positioning in the Market
Retail traders often ask a simple question: where big money is positioning crypto? The answer rarely lies in obvious chart levels. Institutions tend to accumulate positions in areas where liquidity is both deep and discreet. These locations may appear as prolonged consolidations, liquidity sweeps, or slow grinding price movements that seem boring to impatient traders. Yet these quiet phases often represent the exact moments when institutions build their positions.
After a liquidity sweep, markets frequently return to zones where institutional traders reload their exposure. These institutional reloading zones form when price revisits areas where liquidity previously allowed large positions to be executed efficiently. Without real-time liquidity visualization, these zones remain invisible to most traders. With the right tools, however, they become clear footprints of institutional activity.
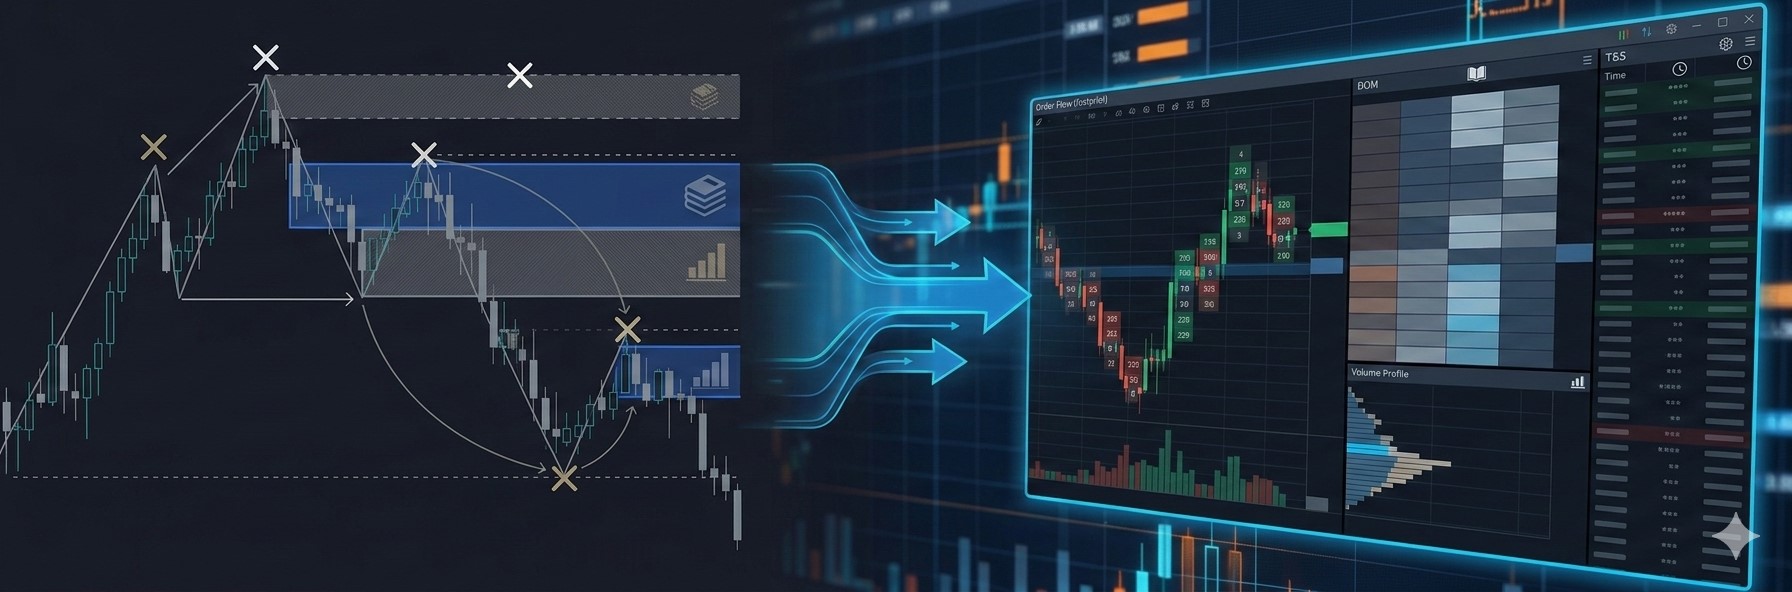
Visualizing Smart Money Liquidity Levels in Real-Time
Technology has transformed how traders analyze markets. Modern smart money concepts software allows traders to visualize liquidity distribution in ways that were impossible just a few years ago. Instead of guessing where liquidity might exist, traders can observe how clusters form and evolve in real time. These tools combine market data from multiple sources to reveal areas of concentrated interest where price is more likely to react.
One of the most valuable features is visualizing SMC liquidity levels in real-time. Rather than relying on static support and resistance, traders can monitor how liquidity flows into specific price zones. When liquidity builds rapidly, it often signals that market participants are preparing for a larger move. Conversely, when liquidity disappears, it may indicate that the market is ready to travel toward deeper liquidity pools.
Another powerful capability involves SMC price magnets visualization. Price magnets represent zones where liquidity concentration increases the probability that price will gravitate toward them. These areas frequently coincide with liquidation clusters, stop losses, or large pending orders. When traders combine structural analysis with these liquidity insights, their market understanding shifts from speculation to evidence-based decision making.
How to Bridge the Gap Between SMC Theory and Real-Time Data
The key to mastering Smart Money Concepts lies in merging structural analysis with real liquidity data. Traditional SMC techniques help traders identify potential zones of interest, such as break-of-structure points or liquidity pools. However, these levels should serve as hypotheses rather than absolute truths. By incorporating institutional order flow crypto analysis, traders can confirm whether the market is actually responding to these levels or ignoring them entirely.
This is where choosing the best tool for smart money concepts trading becomes crucial. Effective platforms provide visual representations of liquidity clusters, stop-loss concentrations, and institutional participation. Instead of guessing where large traders might operate, users can observe how liquidity evolves in real time. When structural levels align with high-density liquidity zones, the probability of meaningful price reactions increases dramatically.
Ultimately, the goal is simple: bridge the gap between SMC theory and real-time data. When traders integrate both perspectives, they gain a clearer understanding of market intent. Liquidity clusters reveal where institutions are likely to engage, while structural analysis explains how price may move between these zones. Together, these insights transform Smart Money Concepts from a theoretical framework into a practical trading methodology.
Step-by-Step: Validating Smart Money Setups Using Institutional Data
The first step in validating a Smart Money setup begins with identifying market structure. Traders should locate areas where liquidity is likely to accumulate, such as equal highs, equal lows, or recent consolidation ranges. These locations often represent potential liquidity targets within the SMC framework. However, rather than entering trades immediately, traders should treat these zones as starting points for deeper analysis.
The second step involves confirming liquidity presence using institutional order flow crypto tools. By analyzing real-time liquidity clusters, traders can determine whether significant stop-loss concentrations exist near their identified levels. If strong clusters appear, the probability that price will interact with the level increases. If liquidity is sparse, the level may lack the fuel needed to drive a meaningful move.
The final step requires confirmation through specialized SMC trading tools crypto. These platforms allow traders to observe liquidity shifts, price magnets, and institutional reloading behavior as the market evolves. When structure, liquidity clusters, and order flow align, traders gain a powerful confluence that significantly improves decision-making.
Smart Money Concepts remain one of the most powerful frameworks for understanding market behavior. Yet their real value emerges only when theory meets data. By combining structural analysis with institutional order flow visualization, traders gain a clearer view of how liquidity drives price. In a market where information is the ultimate edge, learning to validate Smart Money theory with real-time data can transform trading from guesswork into informed strategy.