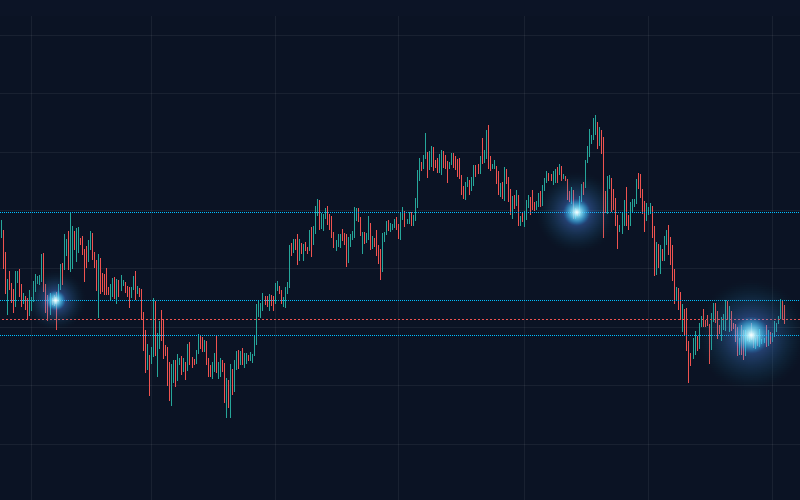
OneWayTicker.com

To the Moon,

But With a Map

Explore the most powerful daily cryptocurrency liquidity zones. Track where the crypto market reloads before the next big move. Analyze the market like a lab - profit like a pro.

Browse all liquidity maps →

BTC Liquidity Map Preview
BTC/USDT · Daily Liquidity Map

Traders' Choice Worldwide 💬

EM

Elor Mesk

Interplanetary Crypto Visionary

Liquidity maps here feel like orbital trajectories — clear, precise, and oddly predictive. If price had a flight path, this would be it.

KW

Katarina Wood

Blockchain Economist

These liquidity structures explain market behavior better than half of the academic models I teach. Clean logic, zero noise — exactly how market analysis should look.

RT

Ronald Tramp

Market Chaos Strategist

For once, I’m not shouting at my screen. The highlighted liquidity levels show exactly where the market intends to strike. Brutally honest readings.

SN

Satoshi Nakomoto Jr.

Blockchain Historian

I've reviewed countless theories of price movement. Liquidity zones presented like this make everything click instantly — it bridges theory and reality.

VB

Vitaliy Buterinov

Distributed Systems Researcher

Markets leave traces — intentions hidden behind every wick. This system exposes those intentions with surprising clarity and accuracy.

MF

Mira Flux

Quant Liquidity Scientist

I spend weeks modeling liquidity flows mathematically. These visual patterns reveal the very same insights in seconds — elegant and precise.

TH

Tariq Hashid

Market Microstructure Analyst

Orderflow chaos becomes readable when liquidity pressure points are mapped like this. It's the first time microstructure feels structured.

JM

Joseph Mbeki

Volatility Engineer

You can literally see where volatility is ready to erupt. Not a forecast — just raw pressure building and releasing right in front of you.

AS

Akira Shinzuru

Algorithmic Trader

My trading scripts finally have something reliable to anchor to. Liquidity-based patterns improved automation precision immediately.

LV

Lucia Vega

Crypto Macro Influencer

Understanding the broader market becomes so much easier when liquidity and structure are laid out visually. It provides context most tools completely overlook.

FAQ – Common Questions 🔍

OneWayTicker is a market analytics platform that visualizes liquidity maps, key trading zones and order-flow-based metrics. It helps traders better understand market structure and identify levels that influence price movement.
Market data on OneWayTicker is updated once per day, immediately after the formation of the daily candle. This provides traders with a clean and reliable snapshot of market conditions — perfect for mid-term analysis and swing trading, where daily structure is more important than intraday noise.
No registration is required. All analytics on OneWayTicker — including metrics, liquidity maps and market zones — are completely free and accessible without creating an account.
Absolutely. OneWayTicker is designed to help beginner traders quickly understand market structure, offering clear visualizations and simple metrics that make learning easier. At the same time, the platform provides powerful analytical layers that experienced traders can use for deeper market insights.
OneWayTicker supports major cryptocurrency markets and is gradually expanding to additional assets.