For years, retail traders have studied Smart Money Concepts hoping to trade like institutions. The idea sounds simple enough: if you can understand how big players operate, you can follow their footprints and ride the same trends. Yet in practice, many traders discover something frustrating. They learn the theory, mark liquidity zones, identify fair value gaps, and still end up entering trades just before the market reverses. The missing piece is often the ability to read institutional order flow crypto in real time.
Markets today move faster than the traditional chart tools most traders rely on. Candlestick patterns and static support levels rarely show where large participants are actively positioning. Institutional traders accumulate positions gradually and strategically, often around hidden pockets of liquidity. Learning how to identify institutional reloading zones and understanding where big money is positioning crypto can dramatically change the way traders interpret price action. Instead of reacting to moves after they begin, traders can start anticipating the next trend expansion.
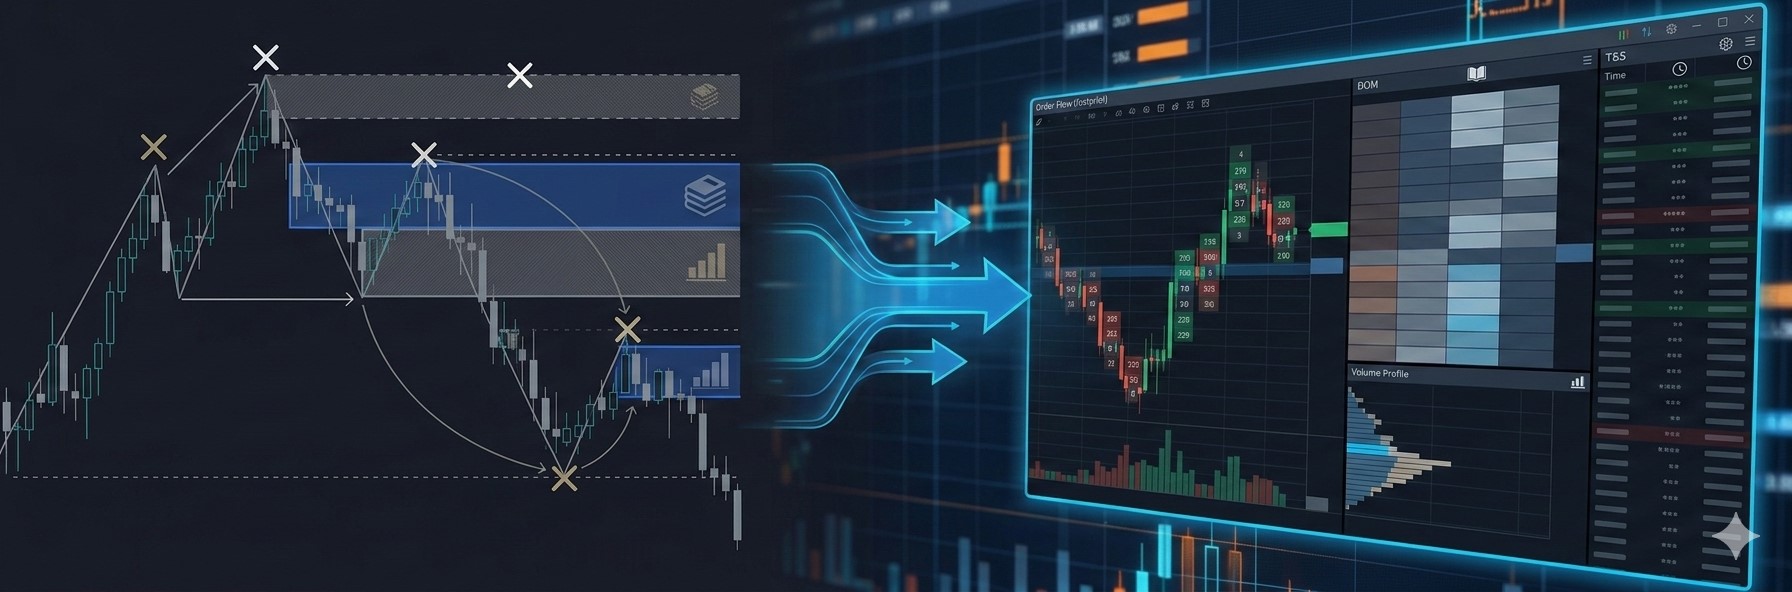
Why Most Smart Money Concepts Traders Still Miss Institutional Order Flow
The popularity of Smart Money Concepts has exploded in the crypto trading community. Tutorials, chart examples, and strategy guides promise to reveal the secrets of institutional trading. However, there is a subtle but critical flaw in how most traders apply these ideas. Many rely purely on historical price structures instead of analyzing live market data. Without tools that interpret real-time order flow, traders struggle to truly understand institutional order flow crypto.
This is where modern SMC trading tools crypto begin to make a difference. Instead of relying only on visual interpretations of price candles, traders can access deeper insights into how liquidity is distributed across the market. Proper smart money concepts software helps traders detect areas where institutional participants may be accumulating or distributing assets. When combined with crypto market microstructure analysis, these insights transform abstract SMC theory into practical trading intelligence.
The Hidden Mechanics of Institutional Stop Loss Clusters
One of the most overlooked elements of institutional trading behavior is the role of stop losses. Retail traders tend to cluster their stop orders around obvious technical levels such as recent highs, lows, or breakout points. Institutional traders are well aware of these tendencies. In fact, many market movements are designed to sweep liquidity from these predictable zones. These areas form what analysts often call institutional stop loss clusters crypto.
When large clusters of stop losses accumulate, they create pools of liquidity that attract professional traders. Triggering these clusters allows institutions to execute large orders without significantly impacting price. In many cases, these liquidity pockets also act as SMC price magnets visualization points, pulling price back toward them before the market resumes its primary direction. Understanding this dynamic helps traders anticipate why the market often returns to certain zones before continuing a trend.
How to Identify Institutional Reloading Zones in Crypto Markets
Institutional traders rarely open a position in a single order. Instead, they accumulate exposure gradually through multiple entries. This process often happens in what traders call institutional reloading zones. These are areas where large participants repeatedly add to positions while maintaining favorable average prices. Learning to identify institutional reloading zones is one of the most valuable skills for traders who want to align themselves with market momentum.
The key lies in combining smart money concepts with deeper crypto market microstructure analysis. By studying liquidity distribution, order book behavior, and recurring reaction levels, traders can begin to see where institutions are defending positions. When price repeatedly reacts within a specific range while liquidity builds around it, the area often becomes a candidate for institutional reloading activity.
This approach helps bridge the gap between SMC theory and real-time data. Traditional chart analysis shows where price has reacted in the past, but modern data visualization reveals where liquidity is actively forming in the present moment. By integrating both perspectives, traders gain a much clearer understanding of market intentions.
Visualizing SMC Liquidity Levels in Real Time
One of the biggest breakthroughs in modern crypto analysis is the ability to visualize liquidity directly on the chart. Instead of guessing where institutional players might place orders, traders can observe clusters of liquidity forming in real time. This ability to support visualizing SMC liquidity levels in real-time gives traders a significant advantage over purely technical approaches.
Advanced SMC trading tools crypto transform complex data into intuitive visual maps. These tools aggregate order flow, stop loss positioning, and liquidity density to highlight areas that may attract institutional activity. As a result, traders no longer need to rely solely on theoretical models. Smart money concepts software allows them to interpret crypto market microstructure analysis visually and understand the true dynamics driving price movement.
Step-by-Step Framework for Tracking Where Big Money Is Positioning Crypto
Applying Smart Money Concepts effectively requires a structured approach. The first step is identifying key liquidity levels across the market. These zones often form near previous highs and lows, consolidation areas, or price imbalances. By marking these levels early, traders begin building a map of potential institutional interest.
The second step involves analyzing institutional order flow crypto. Traders should monitor how price behaves as it approaches major liquidity clusters. Sudden volatility spikes, rapid wicks, or aggressive rejections often indicate that large players are interacting with the market. Institutional stop loss clusters crypto frequently appear during these moments, providing liquidity that institutions can use to accumulate positions.
The final step is interpreting SMC price magnets visualization signals. Certain liquidity zones repeatedly attract price, acting like gravitational centers for the market. When traders recognize these magnets and combine them with smart money concepts software, they gain a clearer picture of where big money is positioning crypto. This perspective allows traders to enter positions earlier and participate in the next trend expansion rather than chasing it.
Smart Money Concepts offer a powerful framework for understanding financial markets, but theory alone rarely delivers consistent results. The real advantage appears when traders combine SMC principles with tools that visualize liquidity and institutional activity. By learning how to identify institutional reloading zones, analyze institutional order flow crypto, and observe liquidity clusters forming in real time, traders move closer to the mindset of professional market participants. Instead of reacting to trends after they begin, they can anticipate where the next expansion is likely to start.